
Northland Power Reports Fourth Quarter 2024 Results and Announces 2025 Financial Outlook
Baltic Power, Hai Long and Oneida projects continue to make construction progress
TORONTO, Feb. 26, 2025 (GLOBE NEWSWIRE) -- Northland Power Inc. (“Northland” or the “Company”) (TSX: NPI) reported today financial results for the three months and year ended December 31, 2024. All dollar amounts set out herein are in thousands of Canadian dollars, unless otherwise stated.
Highlights
- Delivered strong operating results achieving the high end of 2024 financial guidance.
- Appointed Christine Healy as President, Chief Executive Officer (“CEO”) and Director, who started on January 20, 2025.
- Continued to make significant progress on the 2.4 GW of construction projects, Baltic Power, Hai Long, and Oneida.
- Completed the 23 MW upgrade of the Thorold natural gas facility on time and on budget.
- Positioned for growth with a robust balance sheet and available liquidity of $1.1 billion.
- Issued 2025 financial guidance with Adjusted EBITDA expected to increase to $1.3 to $1.4 billion, and Adjusted Free Cash Flow and Free Cash Flow expected to be $1.30 to $1.50 and $1.10 to $1.30 per share, respectively.
- Announced a change in the Dividend Reinvestment Plan (“DRIP”) by eliminating the discount to 0% (previously 3%). The DRIP will be sourced on the market by purchasing shares instead of treasury issuances.
Financial Results
- Revenue from energy sales of $572 million in the fourth quarter of 2024 decreased from $626 million in 2023. Revenue from energy sales increased on a full-year basis to $2,346 million from $2,233 million in 2023.
- Net income increased in the fourth quarter of 2024 to $150 million from a net loss of $268 million in 2023 and increased on a full-year basis to $371 million from a net loss of $96 million in 2023.
- Adjusted EBITDA (a non-IFRS measure) decreased in the fourth quarter to $312 million from $389 million in 2023 and increased on a full-year basis to $1,262 million from $1,240 million in 2023.
- Adjusted Free Cash Flow per share (a non-IFRS measure) decreased in the fourth quarter to $0.31 from $0.75 in 2023 and decreased on a full-year basis to $1.53 from $1.97 in 2023.
- Free Cash Flow per share (a non-IFRS measure) decreased in the fourth quarter to $0.22 from $0.75 in 2023 and decreased on a full-year basis to $1.27 from $1.68 in 2023.
“We are pleased with our fourth quarter and full-year results, achieving the high end of our 2024 financial guidance,” said Christine Healy, Northland’s President and CEO. “We have made excellent progress on our construction projects in Poland, Taiwan, and Canada. Some of these projects are expected to start contributing to Northland’s earnings in 2025, continuing through 2026, with full realization in 2027. Our growth outlook for energy transition and demand for power is stronger than ever. A globally diversified portfolio across multiple technologies and a long-term contract asset base position us well for the future. I look forward to Northland continuing to deliver on its commitments.”
Significant Events and Updates
Growth Updates:
- Thorold Natural Gas Facility Upgrade – In November 2024, Northland completed a 23 MW capacity upgrade on time and on budget; demonstrating Northland’s continued technical expertise and ability to deliver on natural gas assets. In the second quarter of 2023, Northland secured an amended PPA for the Thorold Co-Generation facility located in Ontario, Canada. This agreement allows for an increase in generating capacity and a five-year extension of the contract. The extension of the PPA remains conditional upon the successful completion of an upgrade test scheduled for 2025.
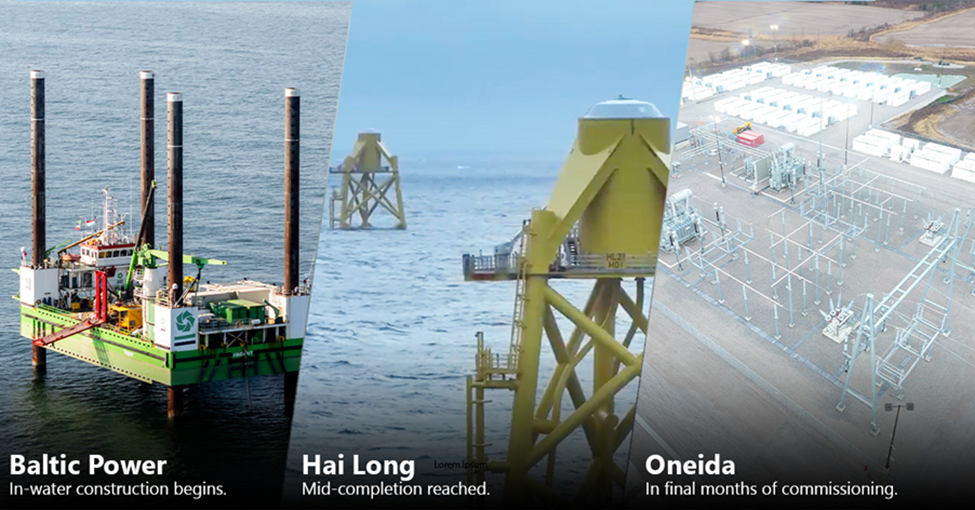
- Construction Update on Hai Long, Baltic Power and Oneida – The Hai Long project has completed over 50% of construction. During the fourth quarter of 2024, fabrication of key components that are required for the 2025 installation campaign progressed. For the full year, the project completed the installation of pin piles and turbine jacket foundations at approximately half of the turbine locations, which are ready for turbine installation in 2025. The fabrication of turbine components continues, including completion of the first sets of towers, generators and nacelles. On August 20, 2024, an incident occurred at the onshore substation due to a leak of carbon dioxide from the fire suppression system, which resulted in three fatalities. The onshore substation construction work was suspended during the investigation of the incident by the local authorities. Upon completion of the investigation, the work on the onshore substation resumed safely according to recovery plans. First power is expected in the second half of 2025. The project is on track to achieve full commercial operations expected in 2027 with overall project cost aligned with original expectations.
The Baltic Power project continues to make progress on fabrication of onshore and offshore substations, foundations, export cables, multiple turbine components and inter-array cables. Major in-water construction activity commenced in January 2025 with the first monopile foundation installation. The offshore substation installation commenced and the first load of transition pieces have been delivered to the project. Construction of the onshore substation and the operations and management building are progressing according to the plan. The project is on track to achieve full commercial operations expected in the latter half of 2026 with overall project cost aligned with original expectations.
The Oneida project is being commissioned with all major construction activities completed. The project is on track to achieve full commercial operations expected in the first half of 2025 with overall project cost aligned with original expectations.
- Other Growth Activity – Following the signing of the 15-year revenue offtake agreement, the 80 MW Jurassic BESS project in Alberta signed its key equipment supplier and construction contracts, and received a key permit to begin construction.
Balance Sheet:
- Changes to Dividend Reinvestment Plan – In February 2025, Northland approved a change in the discount on DRIP issuances from 3% to 0% and confirmed the intention to source shares through secondary market purchases rather than treasury issuances. Such changes will be effective from and as of April 15, 2025 and for the dividend payable thereon to shareholders of record on March 31, 2025. Pursuant to the terms of the DRIP, Northland has the discretion, from time to time, to change the applicable discount and source of shares. If the applicable discount or the source of shares is altered in the future, Northland will include information regarding such change in a press release prior to the effectiveness of the change. Participation in the DRIP is optional. For additional information on the DRIP, see: Dividend Reinvestment Plan.
- Refinancing of EBSA’s Credit Facility – In November 2024, Northland extended the maturity of the non-recourse credit facility associated with EBSA (the “EBSA Facility”) to November 2027 and upsized the facility by $35 million. The financing marginally improved debt terms, and the proceeds were largely used to fund capital investments in EBSA and settle foreign currency maturity hedges.
Other:
- Executive Updates – Christine Healy started as President, Chief Executive Officer and Director on January 20, 2025.
- La Lucha Solar Facility Sale – During the fourth quarter of 2024, Northland received the entire amount relating to a value added tax claim of $42 million (equivalent to MXN 604 million).
Fourth Quarter and Full-Year 2024 Financial Results
Northland successfully ended 2024 achieving the higher end of its 2024 financial guidance for both Adjusted EBITDA and Free Cash Flow per share. Northland exceeded the guidance for Adjusted Free Cash Flow per share.
On a year-over-year basis, financial results for the three months ended December 31, 2024 were lower compared to the same quarter of 2023, primarily due to gains from the partial sell-down of the Hai Long offshore wind project in 2023 and lower offshore wind resource. This decrease was partially offset by lower unpaid curtailments related to negative prices and grid outages at our German offshore wind facilities, higher operating results from onshore renewable facilities, and higher revenue from EBSA due to growth in asset base and rate escalations.
Adjusted EBITDA for the year ended December 31, 2024 was higher, compared to 2023, primarily due to higher wind resource across all offshore wind facilities, higher operating results from onshore renewable facilities which includes full year contribution from New York onshore wind projects, higher revenue from EBSA due to growth in the asset base and foreign exchange changes as well as rate escalations. The results also reflect lower development expenditures due to disciplined spending on priority development activities, as planned. Note that 2023 results included gains from partial sell-down of development assets. Despite these higher operating results, Adjusted Free Cash Flow and Free Cash Flow for the year ended December 31, 2024 were lower, compared to 2023, primarily due to lower foreign exchange and interest rate hedge settlements and higher income taxes.
The following table presents key IFRS and non-IFRS financial measures and operational results. Sales, gross profit, operating income and net income, as reported under IFRS, include consolidated results of entities not wholly owned by Northland, whereas Northland’s non-IFRS financial measures include only Northland’s proportionate ownership interest.
| Summary of Consolidated Results | ||||||||||||||
| (in thousands of dollars, except per share amounts) | Three months ended December 31, | Year ended December 31, | ||||||||||||
| 2024 | 2023 | 2024 | 2023 | |||||||||||
| FINANCIALS | ||||||||||||||
| Revenue from energy sales | $ | 571,867 | $ | 626,221 | $ | 2,346,264 | $ | 2,232,779 | ||||||
| Operating income | 216,571 | 56,633 | 812,892 | 577,988 | ||||||||||
| Net income (loss) | 150,469 | (267,918 | ) | 371,389 | (96,132 | ) | ||||||||
| Net income (loss) attributable to shareholders | 128,294 | (285,595 | ) | 271,825 | (175,194 | ) | ||||||||
| Adjusted EBITDA (a non-IFRS measure) (2) | 312,139 | 388,658 | 1,261,951 | 1,239,871 | ||||||||||
| Cash provided by operating activities | 359,631 | 161,354 | 1,028,968 | 810,699 | ||||||||||
| Adjusted Free Cash Flow (a non-IFRS measure) (2) | 80,650 | 191,289 | 394,420 | 497,978 | ||||||||||
| Free Cash Flow (a non-IFRS measure) (2) | 57,596 | 191,448 | 327,579 | 423,744 | ||||||||||
| Cash dividends paid | 49,284 | 51,740 | 200,488 | 205,072 | ||||||||||
| Total dividends declared (1) | $ | 77,832 | $ | 76,368 | $ | 309,024 | $ | 303,469 | ||||||
| Per Share | ||||||||||||||
| Weighted average number of shares — basic and diluted (000s) | 259,166 | 254,368 | 257,300 | 252,710 | ||||||||||
| Net income (loss) attributable to common shareholders — basic and diluted | $ | 0.49 | $ | (1.13 | ) | $ | 1.03 | $ | (0.72 | ) | ||||
| Adjusted Free Cash Flow — basic (a non-IFRS measure) (2) | $ | 0.31 | $ | 0.75 | $ | 1.53 | $ | 1.97 | ||||||
| Free Cash Flow — basic (a non-IFRS measure) (2) | $ | 0.22 | $ | 0.75 | $ | 1.27 | $ | 1.68 | ||||||
| Total dividends declared | $ | 0.30 | $ | 0.30 | $ | 1.20 | $ | 1.20 | ||||||
| ENERGY VOLUMES | ||||||||||||||
| Electricity production in gigawatt hours (GWh) | 2,836 | 3,353 | 11,046 | 10,380 | ||||||||||
| (1) Represents total dividends paid to common shareholders, including dividends in cash or in shares under Northland’s dividend reinvestment plan. | ||||||||||||||
| (2) See Forward-Looking Statements and Non-IFRS Financial Measures below. | ||||||||||||||
Fourth Quarter Results Summary
Offshore wind facilities
Electricity production for the three months ended December 31, 2024 decreased 12% or 172 GWh compared to the same quarter of 2023, primarily due to lower offshore wind resource, partially offset by lower unpaid curtailments related to negative prices and grid outages at our German offshore wind facilities.
Revenue from energy sales of $280 million for the three months ended December 31, 2024 decreased 18% or $61 million, compared to the same quarter of 2023, primarily due to the lower production by $32 million, and P&I factor adjustment and various other items by $29 million.
Adjusted EBITDA of $181 million for the three months ended December 31, 2024 decreased 17% or $37 million compared to the same quarter of 2023, due to the same factors noted above.
Onshore renewable facilities
Electricity production at the onshore renewable facilities for the three months ended December 31, 2024 was 7% or 55 GWh higher than the same quarter of 2023, primarily due to higher wind and solar resource at the Canadian and New York onshore renewable facilities, partially offset by lower wind resource at the Spanish onshore renewable facilities.
Revenue from energy sales of $124 million for the three months ended December 31, 2024 increased 19% or $20 million compared to the same quarter of 2023, primarily due to higher revenue from the Canadian, New York and Spanish onshore renewable facilities. Please refer to the Management’s Discussion and Analysis for the year ended December 31, 2024, dated February 26, 2025 (“MD&A”) for a further breakdown of Spanish portfolio revenue by component.
Adjusted EBITDA of $83 million was 21% or $14 million higher than the same quarter of 2023, primarily due to the same factors noted above.
Natural gas facilities
Electricity production of 764 GWh for the three months ended December 31, 2024 decreased 21% or 197 GWh compared to the same quarter of 2023, primarily due to lower operating availability because of outages at the natural gas facilities including the planned capacity upgrade at Thorold.
Revenue from energy sales of $79 million for the three months ended December 31, 2024 decreased 11% or $9 million as compared to the same quarter of 2023, primarily due to lower operating availability because of outages at the natural gas facilities.
Adjusted EBITDA of $46 million for the three months ended December 31, 2024 was largely in line with the same quarter of 2023.
Utility
Revenue from energy sales of $92 million for the three months ended December 31, 2024 increased 8% or $6 million compared to the same quarter of 2023, primarily due to the growth in asset base and rate escalations.
Adjusted EBITDA of $41 million for the three months ended December 31, 2024 increased 27% or $9 million compared to the same quarter of 2023, primarily due to the same factors noted above.
Consolidated statement of income (loss)
General and administrative (“G&A”) costs of $27 million in the fourth quarter decreased $11 million compared to the same quarter of 2023, primarily due to restructuring of operating and corporate functions, and La Lucha solar project entering commercial operations in 2023.
Development costs of $20 million decreased $8 million compared to the same quarter of 2023, primarily due to disciplined spending on priority development activities, as planned, and timing of the expenditures.
Finance costs of $97 million decreased 29% or $39 million compared to the same quarter of 2023, primarily due to one-time debt modification loss resulting from optimization of Spanish portfolio debt agreement in 2023 and scheduled principal repayments on facility-level loans.
Fair value gain on financial instruments was $10 million, primarily due to net movement in the fair value of derivatives related to interest rate and foreign exchange contracts.
Foreign exchange loss of $6 million in the fourth quarter was primarily due to fluctuations in the foreign exchange rates.
Share of profit from joint ventures of $23 million in the fourth quarter was primarily due to gain on fair value of derivatives at the joint ventures.
Other income was $129 million lower than the same quarter of 2023, primarily due to the gain on partial sell-down of Hai Long offshore wind projects in 2023, partially offset by the proceeds relating to Deutsche Bucht construction.
Net income of $150 million in the fourth quarter of 2024 compared to a net loss of $268 million in the same quarter of 2023, was primarily as a result of the factors described above.
Adjusted EBITDA
The following table reconciles net income (loss) to Adjusted EBITDA:
| Three months ended December 31, | Year ended December 31, | ||||||||||||||
| 2024 | 2023 | 2024 | 2023 | ||||||||||||
| Net income (loss) | $ | 150,469 | $ | (267,918 | ) | $ | 371,389 | $ | (96,132 | ) | |||||
| Adjustments: | |||||||||||||||
| Finance costs, net | 79,758 | 111,113 | 320,634 | 321,812 | |||||||||||
| Provision for (recovery of) income taxes | 66,615 | (55,577 | ) | 192,167 | 39,129 | ||||||||||
| Depreciation of property, plant and equipment | 148,796 | 156,619 | 615,343 | 595,600 | |||||||||||
| Amortization of contracts and intangible assets | 14,734 | 14,510 | 58,384 | 57,015 | |||||||||||
| Fair value (gain) loss on derivative contracts | (11,333 | ) | 187,830 | 87,592 | 294,544 | ||||||||||
| Foreign exchange (gain) loss | 6,353 | (3,570 | ) | (716 | ) | (39,732 | ) | ||||||||
| Impairment of non-financial assets / Fair value adjustment relating to disposal group classified as held for sale | — | 163,169 | 43,884 | 163,169 | |||||||||||
| Elimination of non-controlling interests | (62,892 | ) | (71,813 | ) | (267,108 | ) | (258,202 | ) | |||||||
| Finance lease (lessor) | (1,053 | ) | (1,291 | ) | (4,577 | ) | (5,609 | ) | |||||||
| Share of (profit) loss from joint ventures | (23,105 | ) | 265,599 | (43,734 | ) | 279,849 | |||||||||
| Others (1) | (56,203 | ) | (110,013 | ) | (111,307 | ) | (111,572 | ) | |||||||
| Adjusted EBITDA (2) | $ | 312,139 | $ | 388,658 | $ | 1,261,951 | $ | 1,239,871 | |||||||
| (1) Others primarily include Northland’s share of Adjusted EBITDA from equity accounted investees, gain on sale of La Lucha solar facility, proceeds relating to Deutsche Bucht construction, Gemini interest income and other expenses (income). | |||||||||||||||
| (2) See Forward-Looking Statements and Non-IFRS Financial Measures below. | |||||||||||||||
Adjusted EBITDA of $312 million for the three months ended December 31, 2024 decreased 20% or $77 million compared to the same quarter of 2023. The significant factors decreasing Adjusted EBITDA include:
- $74 million in gains from the partial sell-down of Hai Long offshore wind project in 2023; and
- $37 million decrease in operating results at the offshore wind facilities, primarily due to lower offshore wind resource, partially offset by lower unpaid curtailments related to negative prices and grid outages at our German offshore wind facilities, as described above.
The factor partially offsetting the decrease in the Adjusted EBITDA was:
- $23 million increase due to higher operating results from onshore renewable facilities and EBSA, as described above.
Adjusted Free Cash Flow and Free Cash Flow
The following table reconciles cash flow from operations to Adjusted Free Cash Flow and Free Cash Flow:
| Three months ended December 31, | Year ended December 31, | ||||||||||||||
| 2024 | 2023 | 2024 | 2023 | ||||||||||||
| Cash provided by operating activities | $ | 359,631 | $ | 161,354 | $ | 1,028,968 | $ | 810,699 | |||||||
| Adjustments: | |||||||||||||||
| Net change in non-cash working capital balances related to operations | (43,309 | ) | 205,865 | 305,084 | 440,828 | ||||||||||
| Non-expansionary capital expenditures | (1,789 | ) | (1,947 | ) | (5,272 | ) | (3,215 | ) | |||||||
| Restricted funding for major maintenance, debt and decommissioning reserves | (8,532 | ) | (8,200 | ) | (20,677 | ) | (11,435 | ) | |||||||
| Interest | (61,913 | ) | (142,890 | ) | (263,499 | ) | (325,841 | ) | |||||||
| Scheduled principal repayments on facility debt | (340,184 | ) | (323,800 | ) | (714,051 | ) | (705,119 | ) | |||||||
| Funds set aside (utilized) for scheduled principal repayments | 148,788 | 158,020 | — | — | |||||||||||
| Preferred share dividends | (1,500 | ) | (1,573 | ) | (6,162 | ) | (6,103 | ) | |||||||
| Consolidation of non-controlling interests | (19,810 | ) | (22,194 | ) | (93,254 | ) | (87,380 | ) | |||||||
| Investment income (1) | 6,791 | 7,374 | 26,888 | 29,685 | |||||||||||
| Others (2) | 19,423 | 159,439 | 69,554 | 281,625 | |||||||||||
| Free Cash Flow (3) | $ | 57,596 | $ | 191,448 | $ | 327,579 | $ | 423,744 | |||||||
| Add back: Growth expenditures | 23,054 | 26,635 | 66,841 | 112,786 | |||||||||||
| Less: Historical growth expenditures’ recovery due to sell-down | — | (26,794 | ) | — | (38,552 | ) | |||||||||
| Adjusted Free Cash Flow (3) | $ | 80,650 | $ | 191,289 | $ | 394,420 | $ | 497,978 | |||||||
| (1) Investment income includes Gemini interest income and repayment of Gemini subordinated debt. | |||||||||||||||
| (2) Others mainly include the effect of foreign exchange rates and hedges, interest rate hedge, Nordsee One interest on shareholder loans, share of joint venture project development costs, acquisition costs, lease payments, interest income, Northland’s share of Adjusted Free Cash Flow from equity accounted investees, gain on sale of La Lucha solar facility, interest on corporate-level debt raised to finance capitalized growth projects and other non-cash expenses adjusted in working capital excluded from Free Cash Flow in the period. | |||||||||||||||
| (3) See Forward-Looking Statements and Non-IFRS Financial Measures below. | |||||||||||||||
Adjusted Free Cash Flow of $81 million for the three months ended December 31, 2024 was 58% or $111 million lower than the same quarter of 2023.
The significant factors decreasing Adjusted Free Cash Flow were:
- $53 million decrease in Adjusted EBITDA (gross of growth expenditures) primarily due to the factors described above;
- $36 million decrease from foreign exchange and interest rate hedges, and other settlements; and
- $23 million increase in scheduled debt repayments on facility-level loans, mainly at Spanish portfolio.
Free Cash Flow, which is reduced by growth expenditures, totaled $58 million for the three months ended December 31, 2024, and was $134 million lower than the same quarter of 2023, due to the same factors as Adjusted Free Cash Flow.
The following table reconciles Adjusted EBITDA to Adjusted Free Cash Flow:
| Three months ended December 31, | Year ended December 31, | ||||||||||||||
| 2024 | 2023 | 2024 | 2023 | ||||||||||||
| Adjusted EBITDA (2) | $ | 312,139 | $ | 388,658 | $ | 1,261,951 | $ | 1,239,871 | |||||||
| Adjustments: | |||||||||||||||
| Scheduled debt repayments | (151,576 | ) | (129,002 | ) | (578,563 | ) | (579,445 | ) | |||||||
| Interest expense | (48,611 | ) | (52,309 | ) | (193,575 | ) | (195,328 | ) | |||||||
| Current taxes | (47,131 | ) | (46,558 | ) | (175,112 | ) | (137,460 | ) | |||||||
| Non-expansionary capital expenditure | (2,015 | ) | (1,938 | ) | (5,078 | ) | (3,016 | ) | |||||||
| Utilization (funding) of maintenance and decommissioning reserves | (7,845 | ) | (6,816 | ) | (18,716 | ) | (10,044 | ) | |||||||
| Lease payments, including principal and interest | (2,908 | ) | (2,365 | ) | (12,586 | ) | (8,677 | ) | |||||||
| Preferred dividends | (1,500 | ) | (1,574 | ) | (6,162 | ) | (6,103 | ) | |||||||
| Foreign exchange hedge gain (loss) | (307 | ) | 5,873 | 12,584 | 36,908 | ||||||||||
| Others (1) | 7,350 | 37,479 | 42,836 | 87,038 | |||||||||||
| Free Cash Flow (2) | $ | 57,596 | $ | 191,448 | $ | 327,579 | $ | 423,744 | |||||||
| Add Back: Growth expenditures | 23,054 | 26,635 | 66,841 | 112,786 | |||||||||||
| Less: Historical growth expenditures’ recovery due to sell-down | — | (26,794 | ) | — | (38,552 | ) | |||||||||
| Adjusted Free Cash Flow (2) | $ | 80,650 | $ | 191,289 | $ | 394,420 | $ | 497,978 | |||||||
| (1) Others mainly include repayment of Gemini subordinated debt, gain on sale of La Lucha solar facility, interest rate and foreign currency hedge settlements, and interest received on third-party loans to partners. | |||||||||||||||
| (2) See Forward-Looking Statements and Non-IFRS Financial Measures below. | |||||||||||||||
2025 Financial Outlook
2025 is a year of delivering key milestones on three large construction projects: Baltic Power, Hai Long and Oneida. Cash generation from some of these projects will be a significant milestone for Northland and is expected to start contributing to Northland’s earnings in 2025, continuing through 2026, with full realization in 2027.
Northland anticipates generating pre-completion revenue from Hai Long in the second half of this year. However, this cash flow is used to fund the construction of the Hai Long project and will not be included in Adjusted Free Cash Flow or Free Cash Flow metrics until the project reaches commercial operations, expected in 2027. Additionally, Northland incurs development expenditures in pursuit of its 10 GW development pipeline. These expenditures will reduce near-term Free Cash Flow until the projects achieve commercial operations but are expected to deliver accretive long-term growth in earnings and cash flow in future years.
Adjusted EBITDA
For 2025, management expects Adjusted EBITDA to be in the range of $1.30 billion to $1.40 billion, with the guidance mid-point being higher than 2024 Adjusted EBITDA of $1.26 billion. The major factors expected to increase Adjusted EBITDA include (all amounts are approximate):
- Adjusted EBITDA contributions from Hai Long’s pre-completion revenues, expected in the second half of 2025, and Oneida energy storage project achieving the commercial operations in the first half of 2025 ($80 million);
- Higher Adjusted EBITDA for onshore renewables excluding Spain ($20 million); and
- Other various items ($25 million).
Increase in Adjusted EBITDA is expected to be partially offset by:
- Lower band revenue adjustments at Spain from lower posted regulatory price ($30 million); and
- Lower contributions from Nordsee One following a scheduled step down in its power contracts, partially offset by impact from the Gemini cable issue and TenneT outage in 2024 ($25 million).
Adjusted Free Cash Flow and Free Cash Flow
In 2025, management expects Adjusted Free Cash Flow to be in the range of $1.30 to $1.50 per share, with the guidance mid-point being lower than 2024 Adjusted Free Cash Flow of $1.53 per share. The major factors expected to decrease Adjusted Free Cash flow include (all amounts are approximate):
- Decreased regulatory feed in tariffs at Nordsee One following a scheduled step down in its power contracts and lower band adjustment at Spain ($45 million); and
- Impact from prior year’s La Lucha operating results including the gain on its sale and other items ($25 million).
Decrease in Adjusted Free Cash Flow is expected to be partially offset by:
- Higher contribution from natural gas facilities and utilities performance and lower net debt service and taxes across existing assets ($30 million); and
- Contribution from Oneida battery storage project and onshore renewable assets excluding Spain ($10 million).
Corporate G&A costs are expected to be approximately $70 million in 2025, compared to $85 million in 2024.
Northland has assumed development expenditures will be approximately $60 million.
Management expects 2025 Free Cash Flow, which includes growth expenditures, to be in the range of $1.10 to $1.30 per share, consistent with last year’s guidance. Free Cash Flow reflects the level of spending on growth initiatives and the equity capital raised for our projects currently under construction, for which material corresponding cash flows will not be received until 2026 and 2027. The development expenditures would include offshore wind opportunities in Europe and Asia and a further allocation towards onshore renewable projects, and natural gas power development opportunities.
In addition, any gains from the future sell-down of ownership interests in development assets would be included in Adjusted EBITDA, Adjusted Free Cash Flow and Free Cash Flow as they relate to capturing development profits at key milestones. Currently, the 2025 financial outlook does not incorporate any sell-down proceeds and as such, net proceeds from any sell-down would increase reported Adjusted EBITDA, Adjusted Free Cash Flow, and Free Cash Flow in the event they occur in 2025.
Northland continues to implement a selective partnership strategy to sell interests in certain development projects on or before financial close. In certain situations, Northland may decide to exit certain markets or reduce development activities within certain jurisdictions. Northland will assess each opportunity individually and intends to remain a long-term owner of the renewable power assets it develops.
Over the longer term, Northland remains positioned to achieve substantial growth in Adjusted EBITDA and Adjusted Free Cash Flow by 2027, upon achieving targeted commercial operations of Oneida, Baltic Power and Hai Long, each with long-term contracted revenues of between 20 to 30 years.
Once the projects under construction, including Hai Long, Baltic Power, and Oneida battery storage, are fully completed, they are collectively expected to deliver on a five-year annual average basis, approximately $570 million to $615 million of Adjusted EBITDA and $185 million to $210 million of Adjusted Free Cash Flow by 2027.
Northland management expects that the Company will continue to pay dividends annually at the rate of $1.20 per share.
With over 3 gigawatts (GW) of current gross operating capacity, 2.4 GW under construction and a pipeline under development of approximately 10 GW, the Company is well-positioned to deliver on the global energy transition. Northland intends to be selective and pursue only projects within its pipeline that meet its strategic objectives and targeted returns and closely monitor macroeconomic conditions. Management continues to assess its development pipeline as projects move through their development cycles.
The information in this Outlook constitutes forward-looking information within the meaning of applicable Canadian securities laws, is based on several assumptions and is subject to risks and uncertainties. See Forward-Looking Statements herein as well as the Risk Factors in Northland’s Annual Information Form for the year ended December 31, 2024, dated February 26, 2025 (“2024 AIF”).
Fourth-Quarter Earnings Conference Call
Northland will hold an earnings conference call on February 27, 2025, to discuss its fourth quarter 2024 results. The call will be hosted by Northland’s Senior Management, who will discuss the Company’s financial results and developments as well as answering questions from analysts.
Conference call details are as follows:
Thursday, February 27, 2025, 10:00 a.m. ET
Participants wishing to join the call and ask questions must register using the following URL below:
https://register.vevent.com/register/BI9fc40d4b1d9d4e0ebcbef3b53626dd1c
For all other attendees, the call will be broadcast live on the internet, in listen-only mode and can be accessed using the following link:
Webcast URL: https://edge.media-server.com/mmc/p/wo2vc2pb
For those unable to attend the live call, an audio recording will be available on northlandpower.com on Friday, February 28, 2025.
Northland’s audited consolidated financial statements for the year ended December 31, 2024, and related MD&A can be found on SEDAR+ at www.sedarplus.ca under Northland’s profile and on northlandpower.com.
ABOUT NORTHLAND POWER
Northland Power is a Canadian-owned global power producer dedicated to accelerating the global energy transition. Founded in 1987, with almost four decades of experience, Northland has a long history of developing, owning and operating a diversified mix of energy infrastructure assets including offshore and onshore wind, solar, battery energy storage, and natural gas. Northland also supplies energy through a regulated utility.
Headquartered in Toronto, Canada, with global offices in seven countries, Northland owns or has an economic interest in 3.2 GW of gross operating generating capacity, 2.4 GW under construction and a significant inventory of early to mid-stage development opportunities encompassing approximately 10 GW of potential capacity.
Publicly traded since 1997, Northland's Common Shares, Series 1 and Series 2 Preferred Shares trade on the Toronto Stock Exchange under the symbols NPI, NPI.PR.A and NPI.PR.B, respectively.
NON-IFRS FINANCIAL MEASURES
This press release includes references to the Company’s adjusted earnings before interest, income taxes, depreciation and amortization (“Adjusted EBITDA”), Adjusted Free Cash Flow, Free Cash Flow and applicable payout ratios and per share amounts, which are measures not prescribed by International Financial Reporting Standards (“IFRS”), and therefore do not have any standardized meaning under IFRS and may not be comparable to similar measures presented by other companies. Non-IFRS financial measures are presented at Northland’s share of underlying operations. These measures should not be considered alternatives to net income (loss), cash flow from operating activities or other measures of financial performance calculated in accordance with IFRS. Rather, these measures are provided to complement IFRS measures in the analysis of Northland’s results of operations from management’s perspective. Management believes that Northland’s non-IFRS financial measures and applicable payout ratio and per share amounts are widely accepted and understood financial indicators used by investors and securities analysts to assess the performance of a company, including its ability to generate cash through operations.
FORWARD-LOOKING STATEMENTS
This press release contains statements that constitute forward-looking information within the meaning of applicable securities laws (“forward-looking statements”) that are provided for the purpose of presenting information about management’s current expectations and plans. Readers are cautioned that such statements may not be appropriate for other purposes. Northland’s actual results could differ materially from those expressed in, or implied by, these forward-looking statements and, accordingly, the events anticipated by the forward-looking statements may or may not transpire or occur. Forward-looking statements include statements that are not historical facts and are predictive in nature, depend upon or refer to future events or conditions, or include words such as “expects,” “anticipates,” “plans,” “predicts,” “believes,” “estimates,” “intends,” “targets,” “projects,” “forecasts” or negative versions thereof and other similar expressions or future or conditional verbs such as “may,” “will,” “should,” “would” and “could”. These statements may include, without limitation, statements regarding future Adjusted EBITDA, Adjusted Free Cash Flow and Free Cash Flow, including respective per share amounts, dividend payments and dividend payout ratios, the timing for and attainment of the Hai Long and Baltic Power offshore wind, Oneida energy storage projects and other renewables growth activity and the anticipated contributions therefrom to Adjusted EBITDA, Adjusted Free Cash Flow and Free Cash Flow, the expected generating capacity of certain projects, guidance, anticipated dates of full commercial operations, forecasts as to overall project costs, the completion of construction, acquisitions, dispositions, whether partial or full, investments or financings and the timing thereof, the timing for and attainment of financial close and commercial operations for each project, the potential for future production from project pipelines, cost and output of development projects, the implementation of the DRIP changes, the all-in interest cost for debt financing, the impact of currency and interest rate hedges, litigation claims, anticipated results from the optimization of the Thorold Co-Generation facility and the timing related thereto, future funding requirements, and the future operations, business, financial condition, financial results, priorities, ongoing objectives, strategies and the outlook of Northland, its subsidiaries and joint ventures.
These statements are based upon certain material factors or assumptions that were applied in developing the forward-looking statements, including the design specifications of development projects, the provisions of contracts to which Northland or a subsidiary is a party, management’s current plans and its perception of historical trends, current conditions and expected future developments, the ability to obtain necessary approvals, satisfy any closing conditions, satisfy any project finance lender conditions to closing sell-downs or obtain adequate financing regarding contemplated construction, acquisitions, dispositions, investments or financings, as well as other factors, estimates and assumptions that are believed to be appropriate in the circumstances. Although these forward-looking statements are based upon management’s current reasonable expectations and assumptions, they are subject to numerous risks and uncertainties. Some of the factors that could cause results or events to differ from current expectations include, but are not limited to, risks associated with further regulatory and policy changes in Spain which could impair current guidance and expected returns, risks associated with merchant pool pricing and revenues, risks associated with sales contracts, the emergence of widespread health emergencies or pandemics, Northland’s reliance on the performance of its offshore wind facilities at Gemini, Nordsee One and Deutsche Bucht for over 50% of its Adjusted EBITDA, counterparty and joint venture risks, contractual operating performance, variability of sales from generating facilities powered by intermittent renewable resources, wind and solar resource risk, unplanned maintenance risk, offshore wind concentration, natural gas and power market risks, commodity price risks, operational risks, recovery of utility operating costs, Northland’s ability to resolve issues/delays with the relevant regulatory and/or government authorities, permitting, construction risks, project development risks, integration and acquisition risks, procurement and supply chain risks, financing risks, disposition and joint-venture risks, competition risks, interest rate and refinancing risks, liquidity risk, inflation risks, commodity availability and cost risk, construction material cost risks, impacts of regional or global conflicts, credit rating risk, currency fluctuation risk, variability of cash flow and potential impact on dividends, taxation, natural events, environmental risks, climate change, health and worker safety risks, market compliance risk, government regulations and policy risks, utility rate regulation risks, international activities, cybersecurity, data protection and reliance on information technology, labour relations, labour shortage risk, management transition risk, geopolitical risk in and around the regions Northland operates in, large project risk, reputational risk, insurance risk, risks relating to co-ownership, bribery and corruption risk, terrorism and security, litigation risk and legal contingencies, and the other factors described in the “Risks Factors” section of Northland’s MD&A and 2024 AIF, which can be found at www.sedarplus.ca under Northland’s profile and on Northland’s website at northlandpower.com.
Northland has attempted to identify important factors that could cause actual results to materially differ from current expectations; however, there may be other factors that cause actual results to differ materially from such expectations. Northland’s actual results could differ materially from those expressed in, or implied by, these forward-looking statements and, accordingly, no assurances can be given that any of the events anticipated by the forward-looking statements will transpire or occur, and Northland cautions you not to place undue reliance upon any such forward-looking statements.
The forward-looking statements contained in this release are, unless otherwise indicated, stated as of the date hereof and are based on assumptions that were considered reasonable as of the date hereof. Other than as specifically required by law, Northland undertakes no obligation to update any forward-looking statements to reflect events or circumstances after such date or to reflect the occurrence of unanticipated events, whether as a result of new information, future events or results, or otherwise.
Certain forward-looking information in this release and the MD&A may also constitute a “financial outlook” within the meaning of applicable securities laws. Financial outlook involves statements about Northland’s prospective financial performance, financial position or cash flows and is based on and subject to the assumptions about future economic conditions and courses of action and the risk factors described above in respect of forward-looking information generally, as well as any other specific assumptions and risk factors in relation to such financial outlook noted in this release and the MD&A. Such assumptions are based on management’s assessment of the relevant information currently available and any financial outlook included in this release and the MD&A is provided for the purpose of helping readers understand Northland’s current expectations and plans. Readers are cautioned that reliance on any financial outlook may not be appropriate for other purposes or in other circumstances and that the risk factors described above or other factors may cause actual results to differ materially from any financial outlook. The actual results of Northland’s operations will likely vary from the amounts set forth in any financial outlook and such variances may be material.
A photo accompanying this announcement is available at https://www.globenewswire.com/NewsRoom/AttachmentNg/df2897ad-3cfd-4fd9-ad3a-80e945a33b9e
For further information, please contact:
Dario Neimarlija, Vice President, FP&A and Investor Relations
647-288-1019
investorrelations@northlandpower.com
northlandpower.com

| About us | Network | Partners |
| Fpgroup.nlinfo@analist.nlRSS feedContactIntellectual Property Photos |
Analist.nlLinksISIN
|
MorningstarPrudena.comAAII.comNASDAQvwd GroupEuronextBATS Chi-x
|